There is a management maxim that holds true across every industry: “If you can’t measure it, you can’t manage it”. When applied to the high-stakes world of financial planning and analysis (FP&A), this principle is even more critical. For large-scale projects like Planning Process Automation (PPA), the real rule becomes: If you can’t measure it, you can’t justify it.
The implementation of PPA is a major investment, often requiring significant time, resources, and change management. Yet, automation is not a self-proving success; it is a success proven through data. For CFOs, measurement is the accountability mechanism that ensures the technological investment drives real business outcomes.
The true acid test of a successful automation project is simple: Is it delivering better decisions, faster? If you can’t definitively answer “Yes,” your project is incomplete.
The Metrics That Matter: Proving Agility, Reliability, and Engagement
To validate your automation efforts, you must rigorously track a set of key performance indicators (KPIs) that demonstrate improvements in agility, reliability, and engagement.
1. Planning Cycle Time (Proving Speed)
This is perhaps the most immediate and tangible measure of success. Cycle time tracks the total duration required to complete a planning process, from data collection to final executive approval. Before automation, monthly budget re-forecasting might take two weeks. A successful PPA implementation should shrink this dramatically, allowing the finance team to shift from time-consuming data crunching to value-added analysis. This speed is the foundation of planning agility.
2. Forecast Accuracy (Proving Reliability)
Speed is meaningless without quality. Automation should not just accelerate the process; it should improve the quality of the output. Higher forecast accuracy—measured by the mean absolute percentage error (MAPE) between the forecast and actual results—demonstrates that the models are more reliable, the data inputs are cleaner, and the underlying logic is superior. This builds trust in the new system across the organization.
3. Plan Frequency (Proving Agility)
A key benefit of reducing cycle time is the ability to increase frequency. If your team was previously limited to quarterly plans, automation should enable monthly or even weekly/daily planning cycles. This move from static, infrequent plans to dynamic, continuous planning is a critical indicator that the business can adapt timeously to market shifts.
4. User Adoption (Proving Engagement)
If the new automated tools are cumbersome or poorly designed, users will revert to spreadsheets. High user adoption rates—tracked by login frequency, report generation, and utilization of new features—are crucial. It signals that the PPA is truly elevating the team’s contribution and satisfaction, leading to greater engagement.
5. Boardroom Applause (Proving Strategic Impact)
This metric may be the most qualitative, but it is often the most important. When faster, more accurate plans lead directly to improved capital allocation, superior resource deployment, and better bottom-line results, the proof is in the response of the executive leadership. When your finance presentations are focused on strategic insight (not data collection) and receive genuine excitement, you’ve achieved PPA validation.
Making Validation Visible: Dashboards and Cadence
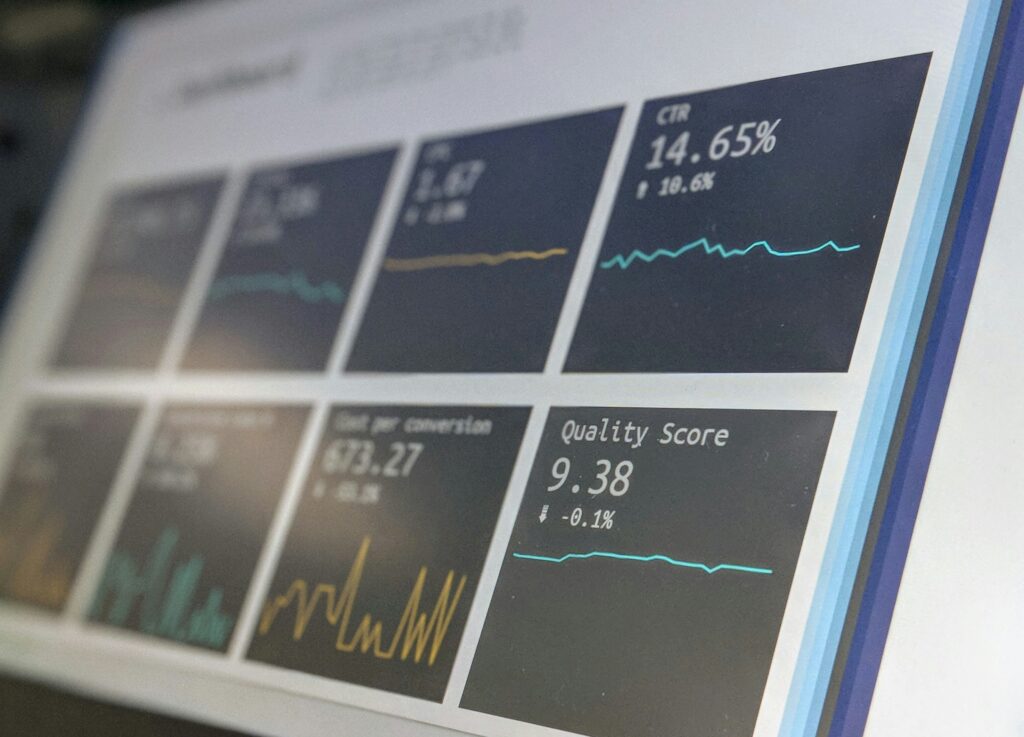
The best practice for validation is to use dashboards that make the ROI visible at a glance. You should review these critical KPIs with a regular cadence. At a minimum, review them monthly, but depending on your industry and market volatility, weekly or even daily monitoring may be necessary.
This consistent monitoring allows you to catch issues early before they derail the project, and, just as importantly, to celebrate wins timeously.
Automation gives you leverage , but measurement gives you proof. The mandate for every CFO is clear: Don’t just automate—validate. Start tracking your post-automation KPIs today to show the measurable impact of smarter planning.


